
# Canvas Tools
Editor: toolbar above the canvas
The canvas shows the simulation in 3D or in a 2D slice. The toolbar above it sets the domain, changes the view, cuts a cross-section, shows the Python script and saves an image. Buttons on the canvas zoom and turn it. The toolbar is not in the Results tab.
# Toolbar

Canvas toolbar
| Tool | What it does |
|---|---|
| Domain | Opens Edit Domain Dimension. The badge above the button shows the dimension (1D, 2D or 3D). |
| View | Shows or hides parts of the view (see below). |
| Cross-Section | Opens the Cross-Section panel: a 2D slice of the simulation, for inspection (see below). |
| Add Structure | Adds a structure. See Structures. |
| Script | Shows the Python script of the simulation. |
| Save Image | Saves the current view as a PNG image. |
| AI | Opens the AI Assistant (Beta) chat. Describe an object to add, for example a sphere, then Accept or Decline the result. FDTD projects only, while the project is a draft. A daily limit applies. |
When you select an object, the toolbar shows actions for it, such as Edit and Hide.
# Domain
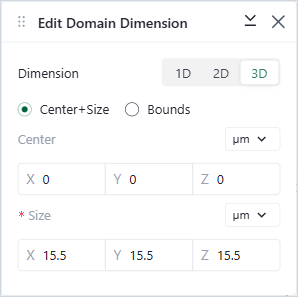
Edit Domain Dimension panel
Choose the Dimension, then set the domain with Center+Size or Bounds.
# View
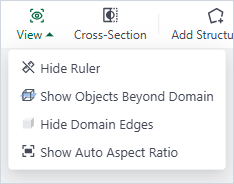
View menu
Each item switches one part of the view: the ruler, the objects beyond the domain, the domain edges, and the aspect ratio (auto or equal). The label says what a click does, for example Hide Ruler while the ruler shows. The objects beyond the domain and the aspect ratio cannot change while Cross-Section is on.
# Cross-Section
- Clipping Plane: choose X, Y or Z, then set the Plane position.
- Switches that show more on the slice. In FDTD they are Show Simulation Grid, Show Boundaries, Show Sources and Monitors, Plot Permittivity and Show 3D View. Other project types show their own set, for example Show Ports & Cells in EME, or a choice between Permittivity and Thermal Conductivity in Heat.
- Measure: click and drag on the slice to measure the distance between two points.
The grid and permittivity switches wait until the editor has computed the grid ("Grid Loading"). They do not support geometries from STL files (TriangleMesh). The slice always uses an equal aspect ratio.
# Zoom and Turn

Zoom buttons
| Button | Shortcut |
|---|---|
| Zoom In | Ctrl and + (⌘ and + on a Mac) |
| Zoom Out | Ctrl and − (⌘ and − on a Mac) |
| Zoom Window: drag a box to zoom into | Z |
| Reset View | Ctrl and 0 (⌘ and 0 on a Mac) |
Click the arrows around the view cube, at the bottom right, to turn the view.
Right-click the canvas for Show (show all structures, monitors or sources), Enable (enable all of them) and Export Model (Export GLB, Export OBJ, Export STL and View Python Script).