
# Heat Results
Editor: Results tab of a Heat project · Python: td.HeatChargeSimulationData
After a Heat simulation finishes, open the Results tab. Each temperature monitor appears under Monitor Datasets, with its Temperature in kelvin (K).
# Temperature
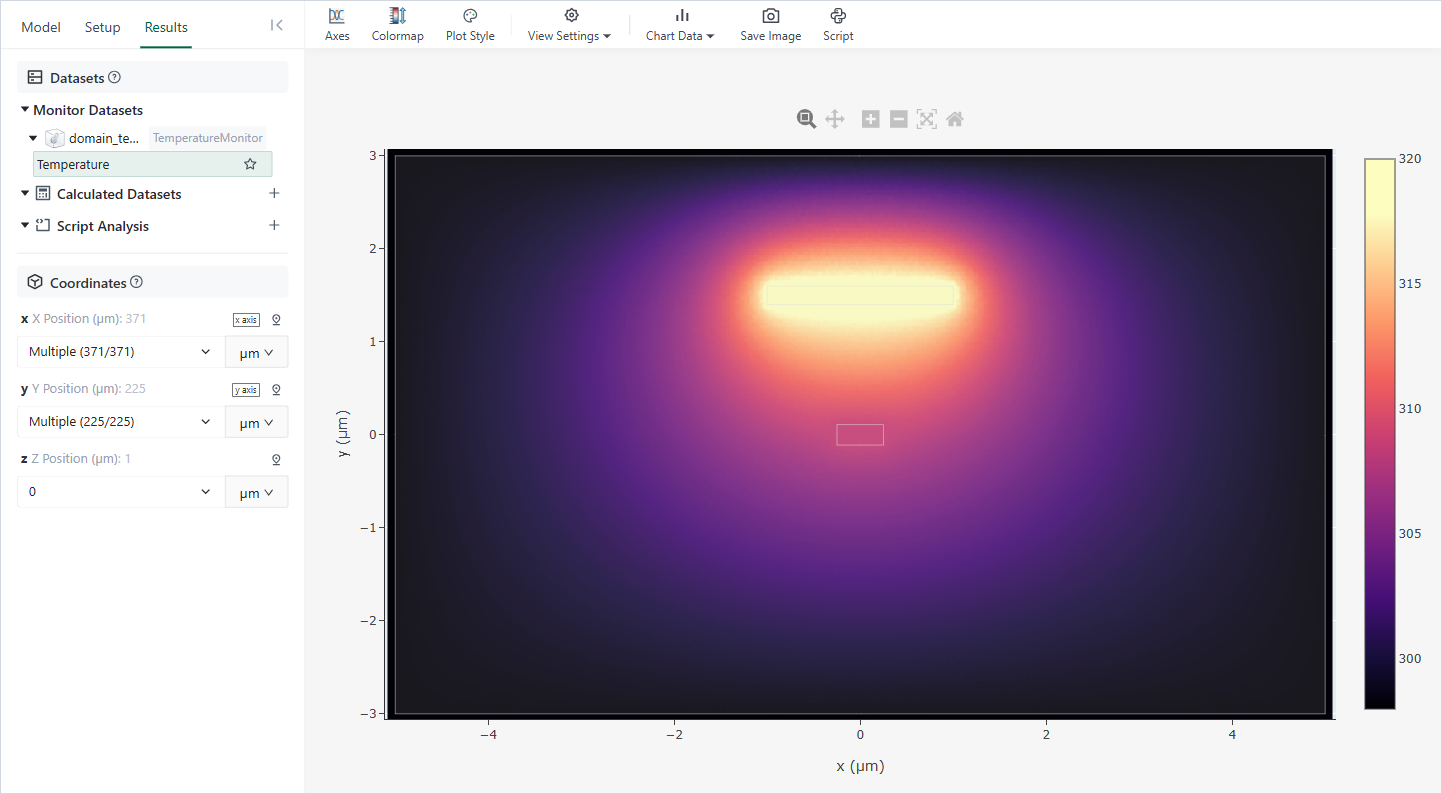
Results tab
- Open Monitor Datasets › your monitor › Temperature to plot it. A new Heat project has the monitor domain_temp_monitor, which covers the whole domain.
- In Coordinates, each axis shows its number of points. Multiple with x axis or y axis plots the data along that axis. Pick one value to plot a cut, for example the temperature along a line.
- Hold the pointer over the plot to read the temperature at a point.
The toolbar above the plot has Axes, Colormap, Plot Style, View Settings, Chart Data, Save Image and Script. The settings are the same as for the other project types; see Mode Solver Result.
# Calculated Datasets and Script Analysis
- Click + next to Calculated Datasets to compute new data from the results in the Dataset Editor.
- Click + next to Script Analysis to analyze the results in a Python notebook (see Script Analysis).