
# Find the Temperature Around a Heater
Editor: Heat project › Model, Setup and Results tabs · Python: td.HeatChargeSimulation
You get the temperature in the cross-section of a silicon waveguide under a heater, and how much the waveguide warms up.
# Before You Start
- A new Heat project. See Create Your First Project and choose the HEAT tab.
- The editor uses µm: thermal conductivity in W/(µm·K) and heat rates in W/µm³. For example, 1.4 W/(m·K) is 1.4e-6 W/(µm·K).
Cloud only
This run costs about 0.03 FlexCredits.
# Steps
Click Domain on the canvas toolbar. Choose 2D, keep the design plane XY, and set Size to 10 and 6 (µm).
In Model › Mediums, click +, then New Medium. Set Name to oxide and Thermal conductivity to 1.4e-6, and click OK. Add a second medium, silicon, with 1.5e-4.
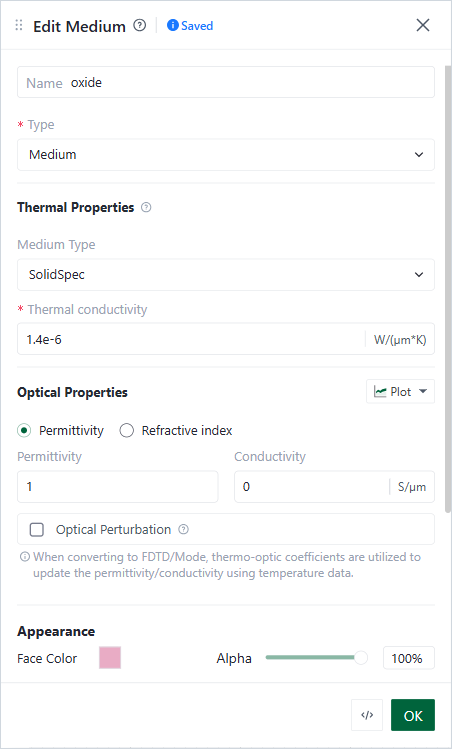
Edit Medium form
In Model › Structures, click +, then Rectangle. Add three rectangles, in this order:
Name Center (µm) Size (µm) Medium cladding 0, 0 inf, inf oxide waveguide 0, 0 0.5, 0.22 silicon heater 0, 1.5 2, 0.2 silicon Where structures overlap, the one added later wins. So the cladding comes first.
In Setup › Boundary Conditions, click +, then TemperatureBC. Keep Temperature 298.15 K, Placement SimulationBoundary and all Surfaces, and click OK. All edges of the domain then stay at 298.15 K.
In Setup › Sources, click +, then Heat Source. Set Rate to 3e-4 W/µm³ and Structures to heater, and click OK.
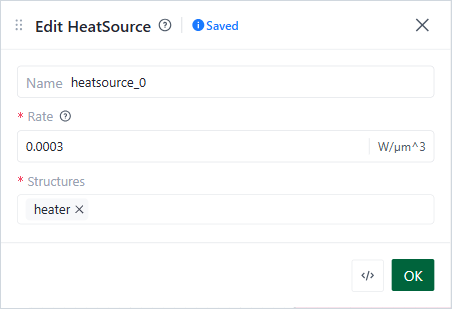
Edit HeatSource form
In Setup › Configuration › Grid Specification, set Type to UniformUnstructuredGrid and Dl to 0.05 µm, and click OK. A new Heat project has no grid.
Click Check Simulation and wait for Validation Passed. Click Run Simulation. When the Congratulations! dialog shows, click Go To Simulation Results.
# Check the Result
In the Results tab, open Monitor Datasets › domain_temp_monitor › Temperature. A new Heat project has this monitor; it covers the whole domain.
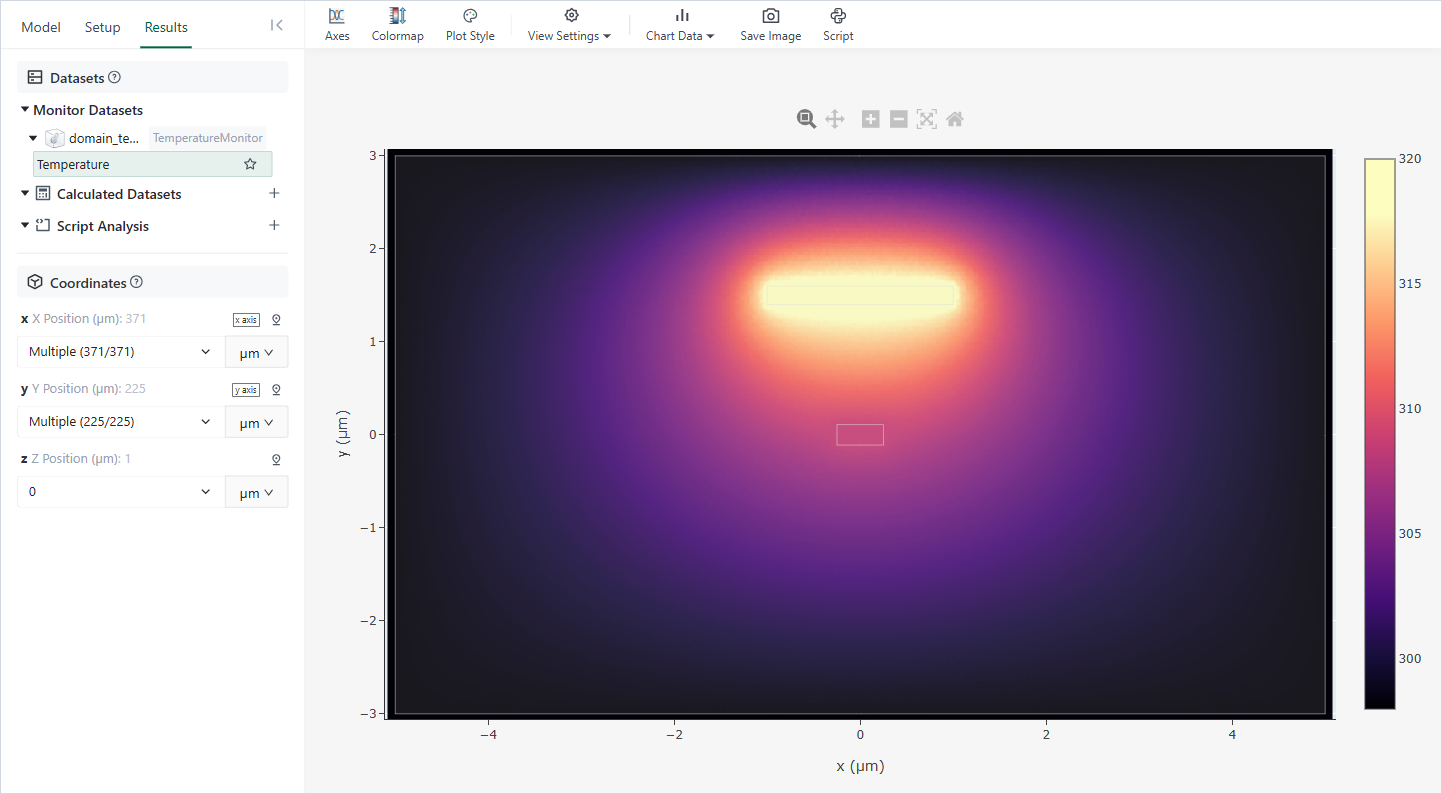
Results tab
The heater reaches about 319 K, 21 K above the edges. The waveguide, 1.5 µm below it, reaches about 309 K: it warms up by about 10 K. Hold the pointer over the map to read the temperature at a point.
In this setup, the temperature rise is proportional to the Rate. For about 5 K at the waveguide, halve the rate.
If the check shows an error, see Heat Troubleshooting.