
# Find the Modes of a Waveguide
Editor: Mode project › Model, Setup and Results tabs · Python: td.ModeSimulation
You get the two lowest-order modes of a silicon strip waveguide surrounded by vacuum, with their effective index and field profile, from 1.5 to 1.6 µm.
# Before You Start
- A new Mode project. See Create Your First Project and choose the MODE tab.
Cloud only
This run costs about 0.005 FlexCredits.
# Steps
In Model › Structures, click +, then Strip under Waveguide Templates. The editor adds the structure waveguide, the medium core_medium, and three parameters.
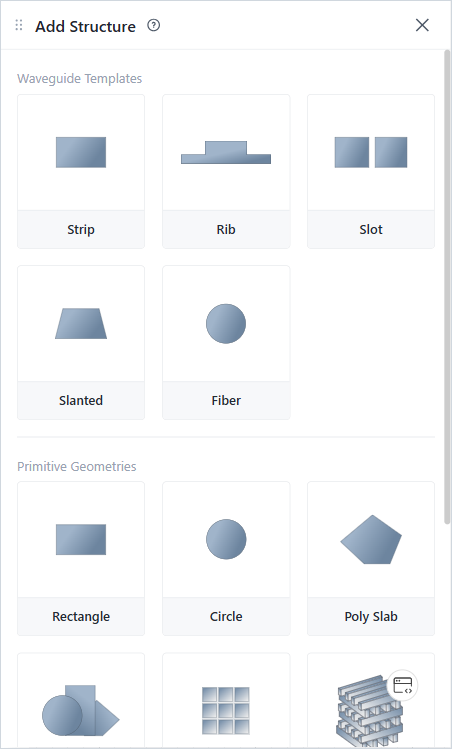
Add Structure panel
Open Parameters in the bottom bar. Set
core_widthto 0.5,core_thicknessto 0.22 andcore_nto 3.48 (silicon at 1.55 µm).In Setup › Mode Specifications, set Number of modes to 2. Keep the wavelength range 1.5–1.6 µm with 5 points.
Click Check Simulation. Wait for Validation Passed.
Click Run Simulation.
# Check the Result
The Results tab opens with n_eff of mode 0 plotted against wavelength. The effective index falls from about 2.40 at 1.5 µm to about 2.28 at 1.6 µm.
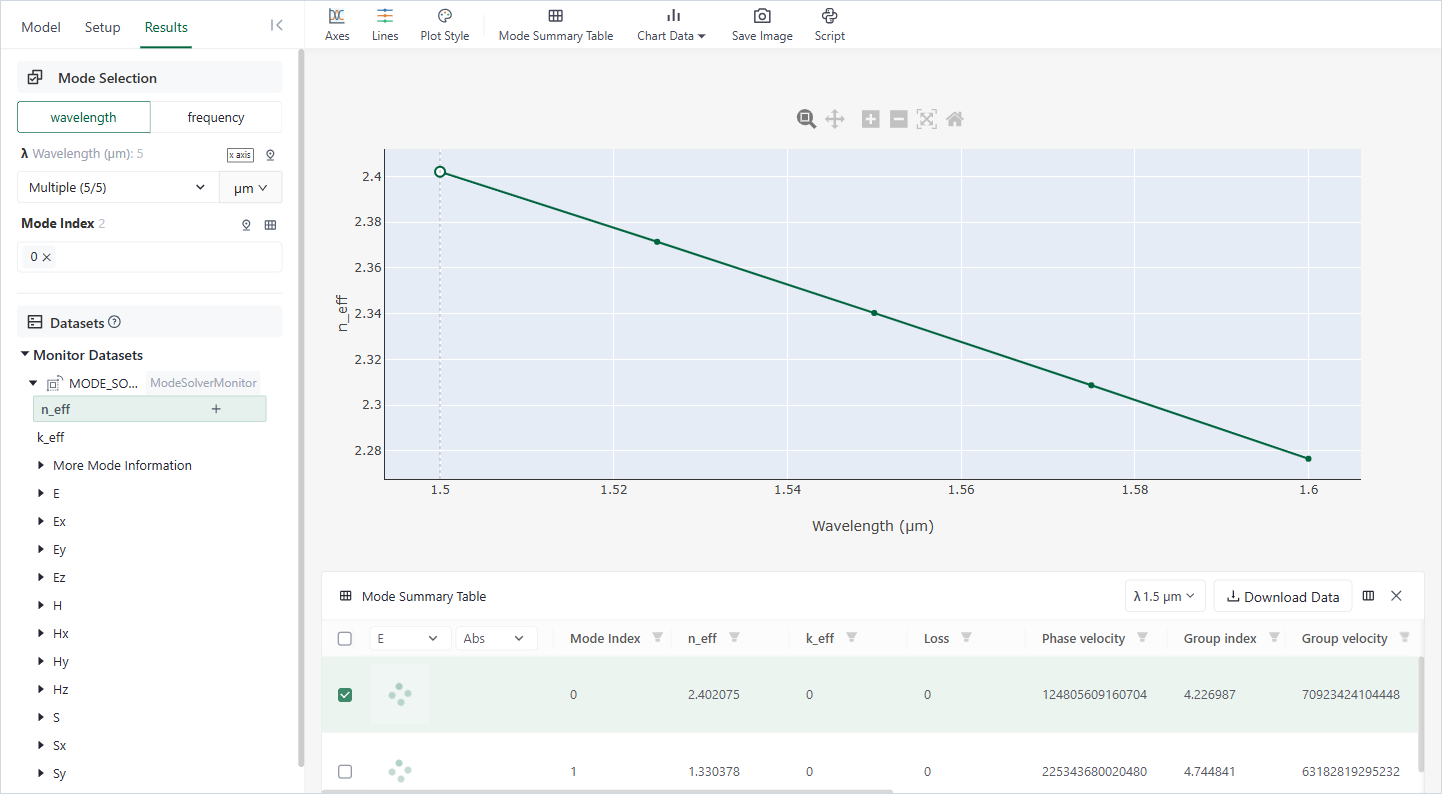
Results tab
Click Mode Summary Table in the toolbar to compare the modes at one wavelength. At 1.5 µm, mode 0 has an effective index of about 2.40 and mode 1 about 1.33. Both are above 1, the index of the vacuum around the core, so both modes are guided.
To see a field profile, open E › Magnitude (abs). Pick the wavelength and the Mode Index in Mode Selection.
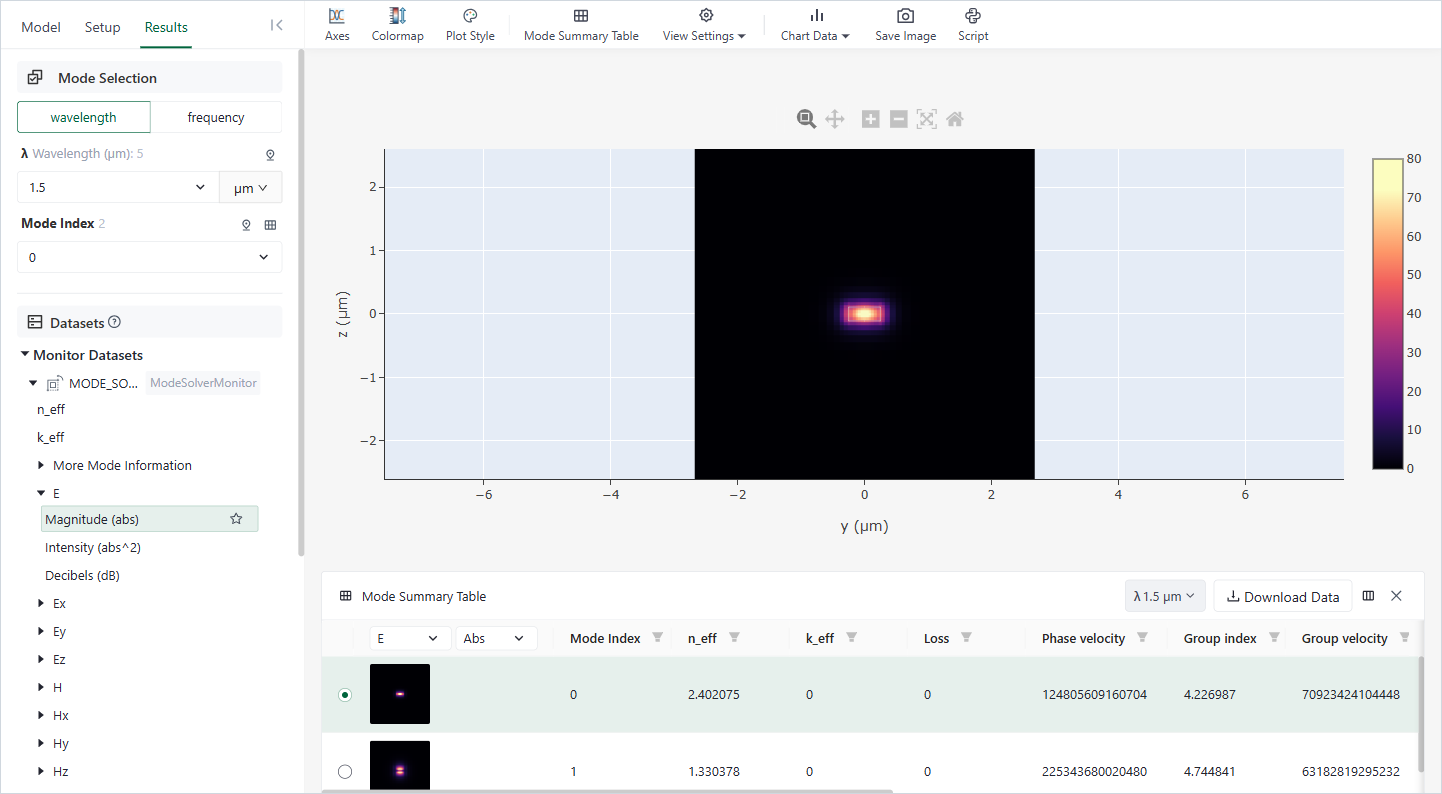
Results tab: field profile
If the check shows an error or the modes look wrong, see Mode Troubleshooting.