
# Sweep the Length of a Waveguide Taper
Editor: EME project › Model, Setup and Results tabs · Python: td.EMESimulation
You get the transmission of a silicon taper from a 0.5 µm to a 2 µm wide waveguide, for 8 taper lengths from 2 to 16 µm, in one run.
# Before You Start
- A new EME project. See Create Your First Project and choose the EME tab. It starts with one wavelength, 1.55 µm, and the propagation axis X.
Cloud only
This run costs about 0.16 FlexCredits.
# Steps
Click Domain on the canvas toolbar. Set Size to 10, 4 and 2 (µm).
In Model › Mediums, click +, then Material Library. Search "Silicon", pick Silicon (Crystalline) ("cSi") › Palik_NoLoss, and click OK.
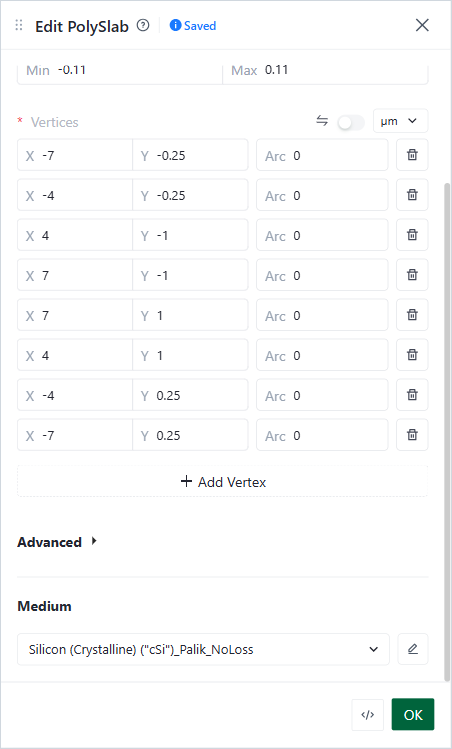
In Model › Structures, click +, then Poly Slab. Set Name to taper and Slab bounds to −0.11 and 0.11. Enter 8 Vertices (click Add Vertex for each new row): (−7, −0.25), (−4, −0.25), (4, −1), (7, −1), (7, 1), (4, 1), (−4, 0.25), (−7, 0.25). Set Medium to the silicon and click OK.
Edit PolySlab form
The shape is a 0.5 µm waveguide, an 8 µm taper from x = −4 to 4, and a 2 µm waveguide.
In Setup › EME Specifications › Cells & Modes, keep Grid type Uniform. Set Number of cells to 40 and Number of modes to 5. Click OK.
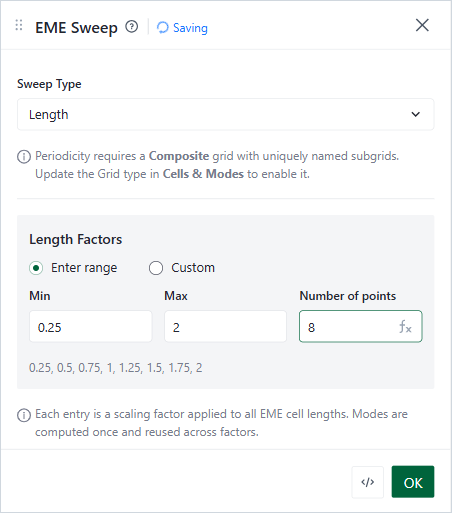
In Setup › EME Specifications › EME Sweep, set Sweep Type to Length. Under Length Factors, choose Enter range and set Min 0.25, Max 2 and Number of points 8. Click OK.
EME Sweep panel
Each factor multiplies the length of every EME cell. Factor 1 is the taper as drawn (8 µm). Factor 0.25 is a 2 µm taper.
Click Check Simulation. Wait for Validation Passed.
Click Run Simulation. When the Congratulations! dialog shows, click Go To Simulation Results.
# Check the Result
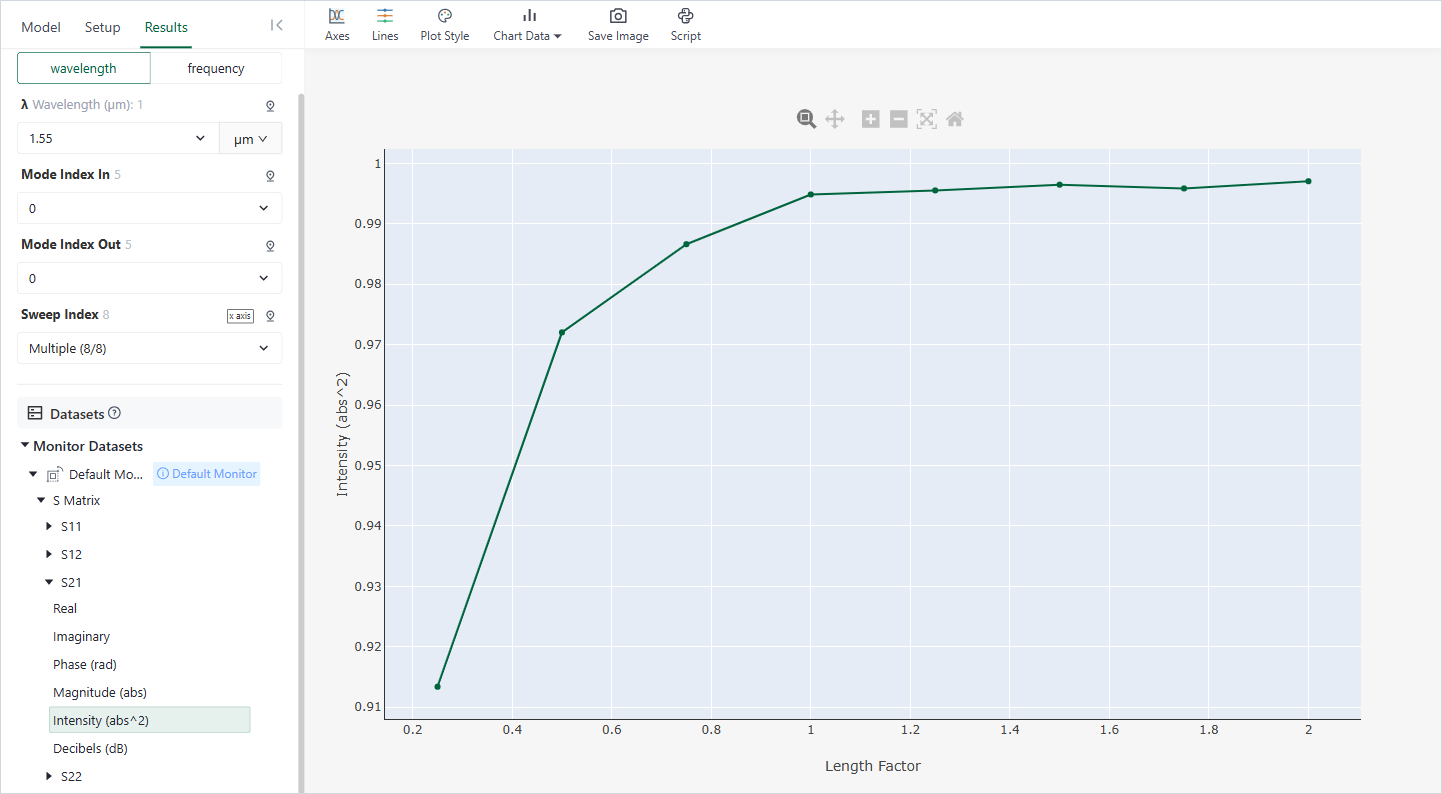
In the Results tab, open Monitor Datasets › Default Monitor › S Matrix › S21 › Intensity (abs^2). Keep Mode Index In and Mode Index Out at 0.
Results tab
The curve is the share of the power in mode 0 at port 1 that leaves port 2 in mode 0. It rises from about 0.91 for a 2 µm taper (factor 0.25) to 0.995 for an 8 µm taper (factor 1). Longer tapers add little.
With 10 cells instead of 40, the sweep gives wrong values, for example 0.93 at factor 1. Always check that more cells do not change the result (see Cells & Modes).
If the check shows an error, see EME Troubleshooting.