
# Measure Transmission Through a Waveguide
Editor: FDTD project › Model, Setup and Results tabs · Python: td.Simulation
You get the share of the power that travels through a silicon waveguide, at each wavelength from 1.5 to 1.6 µm.
# Before You Start
- An FDTD project with the wavelength range 1.5–1.6 µm (Setup › Configuration › Wavelength). See Create Your First Project.
Cloud only
This run costs about 0.025 FlexCredits.
# Steps
Click Domain on the canvas toolbar. Set Size to 6, 3 and 2 (µm).
In Model › Mediums, click +, then Material Library. Search "Silicon", pick Silicon (Crystalline) ("cSi") › Palik_NoLoss, and click OK.
In Model › Structures, click +, then Box. Set Name to waveguide, Size to inf, 0.5 and 0.22, and Medium to the silicon. Click OK. With inf (Infinity), the waveguide passes through the boundaries.
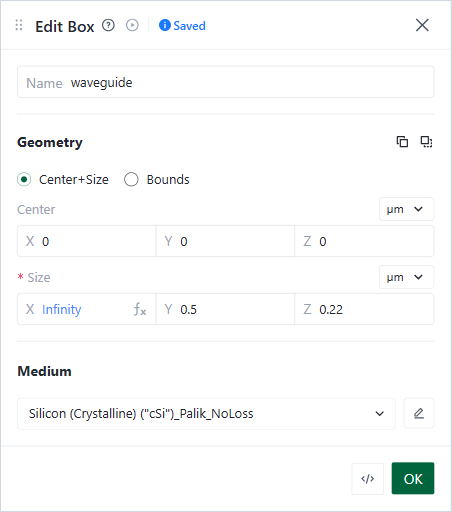
Edit Box form
In Setup › Sources, click +, then Mode Source. Set Center X to −2, and Size Y and Z to 2 and 1.5. Keep + (Forward) and Mode index 0. Click OK.
In Setup › Monitors, click +, then Flux Monitor. Set Center X to 2, and Size Y and Z to 2 and 1.5. Click OK.
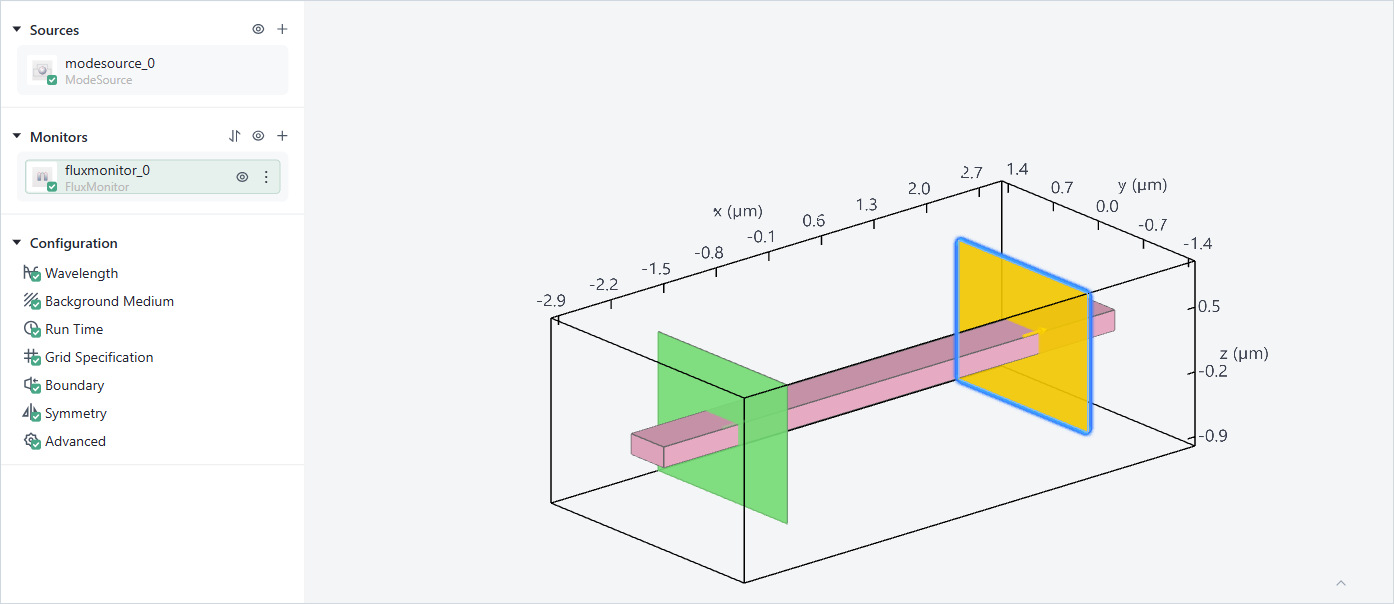
Setup tab
Click Check Simulation. Wait for Validation Passed.
Click Run Simulation. When the Congratulations! dialog shows, click Go To Simulation Results.
The source and the monitor use Set the range from the global wavelength, so they cover 1.5–1.6 µm without more settings.
# Check the Result
In the Results tab, open Monitor Datasets › fluxmonitor_0 › flux › Linear.
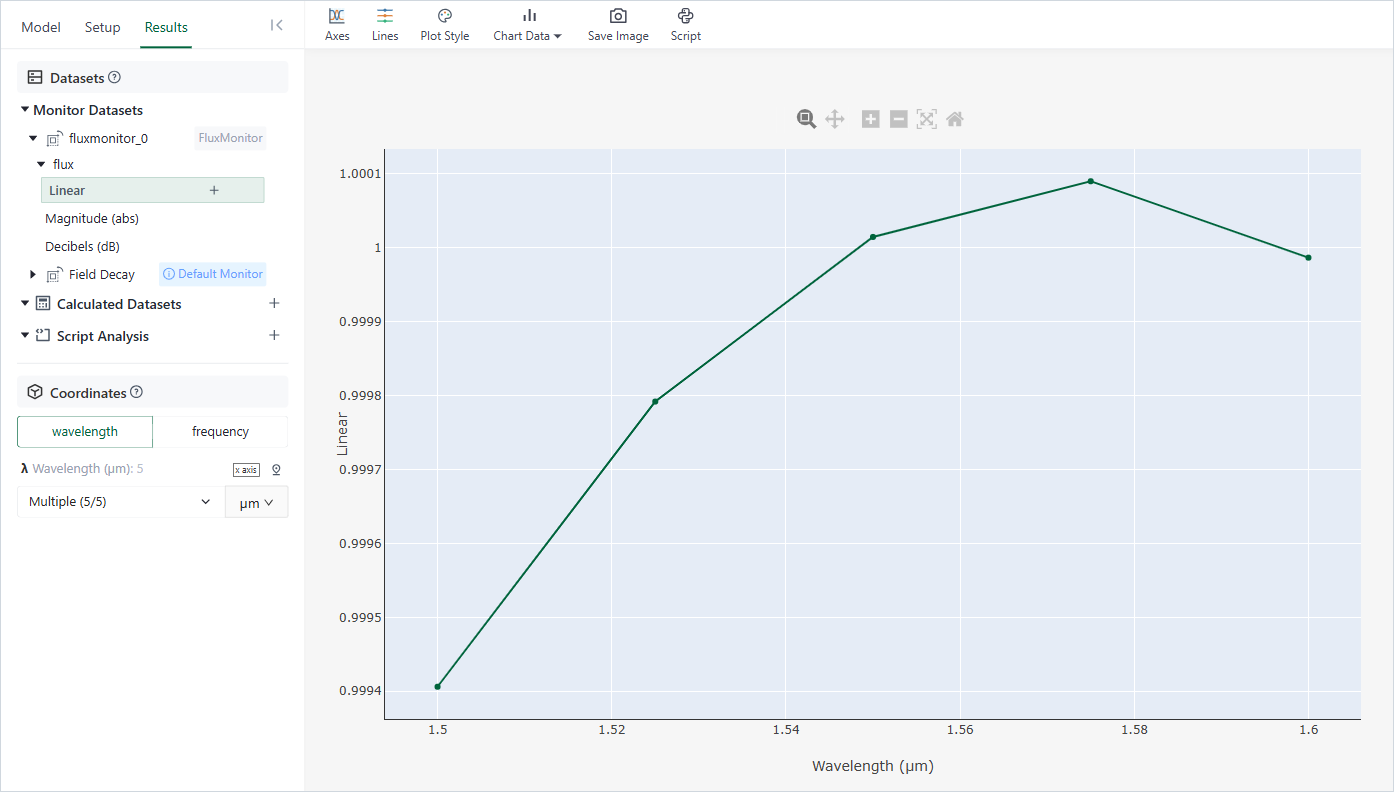
Results tab
The flux is normalized to the power of the source, so it is the transmission. For this straight, lossless waveguide it is close to 1 at every wavelength. To see it in decibels, pick Decibels (dB).
If the check shows a warning or the run fails, see FDTD Troubleshooting.