
# Monitors
Editor: Setup › Monitors
A monitor records results in a region of the simulation: fields, power, mode amplitudes or material data. Most monitors record at chosen wavelengths. The time monitors record over time. You read the data in the Results tab, under Monitor Datasets.
# Add a Monitor
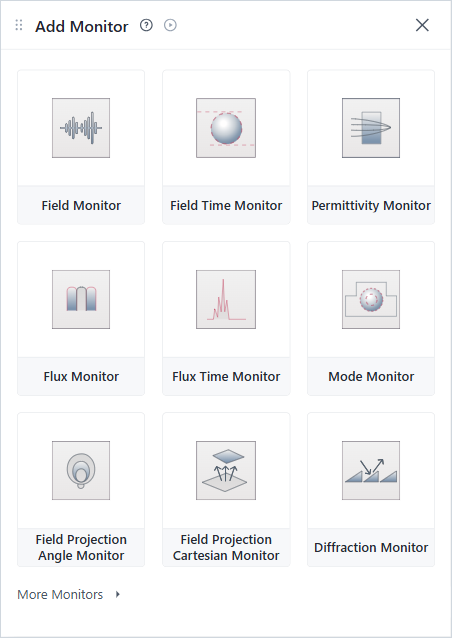
Add Monitor panel
- In Setup › Monitors, click +.
- Click a monitor type. Click More Monitors to see the rest.
- In the monitor's form, set its position, size and wavelengths.
# How to Choose
| If you want to … | Use |
|---|---|
| Measure transmission or reflection (power through a plane) | Flux Monitor |
| Measure the power that leaves a closed box | Flux Monitor with a 3D size |
| See the field pattern on a plane or in a volume | Field Monitor |
| See how the fields or the power change over time | Field Time Monitor or Flux Time Monitor |
| Find how much power goes into each waveguide mode | Mode Monitor |
| See the mode profiles on a plane | Mode Solver Monitor (More Monitors) |
| See the far field, by angle or on a distant plane | Field Projection Angle Monitor, Field Projection Cartesian Monitor or Field Projection K Space Monitor (More Monitors) |
| Find the power in each diffraction order of a periodic structure | Diffraction Monitor |
| Find the coupling into a Gaussian beam, for example a fiber | Gaussian Overlap Monitor or Astigmatic Gaussian Overlap Monitor (More Monitors) |
| Check the material data on the grid | Permittivity Monitor, or Medium Monitor (More Monitors) |
Every FDTD run also records the field decay.
The editor does not offer the SurfaceFieldMonitor and the SurfaceFieldTimeMonitor. Use them from the Tidy3D Python client.
# Common Mistakes
- The monitor records wavelengths that no source sends. The check then warns. See FDTD Troubleshooting.
- A large Field Monitor with many wavelengths. It can store many gigabytes, and the check warns. Make it smaller, or use fewer wavelengths.